GeoWGS84 Corp Acquires LizardTech Suite of Products, Including GeoExpress and the MrSID Format. Click here for details
Contour Map : Simple Definition and Meaning
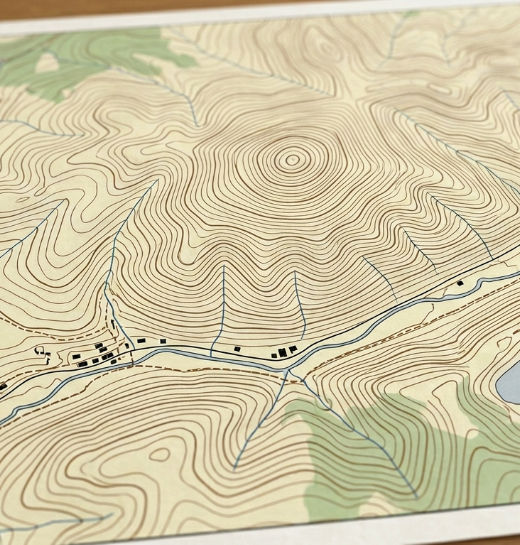
A contour map is a kind of topographic map that shows the shape and elevation of the land surface using contour lines. Each contour line connects points that have the same height above a fixed reference level, usually mean sea level. These lines help represent the three-dimensional form of the ground on a two-dimensional map. By studying how the lines are arranged and how far apart they are, we can interpret different landforms and terrain features such as hills, valleys, ridges, and slopes. When contour lines are very close together, it indicates a steep slope where the elevation changes quickly over a short distance. When the lines are far apart, it shows a gentle slope with gradual elevation change. In this way, contour maps provide a clear visual understanding of the landscape’s relief and help in activities like navigation, planning, and geographic analysis.
Contour maps are an important tool used in geography, surveying, engineering, environmental science, and land-use planning. They show the three-dimensional surface of the Earth on a two-dimensional map by using contour lines that connect points of equal elevation. This makes it possible to clearly understand the shape and height of landforms such as hills, valleys, slopes, and plateaus, along with changes in elevation across a region. Closely spaced contour lines indicate steep slopes, while widely spaced lines show gentle terrain, helping users quickly assess the difficulty and accessibility of an area.
In civil engineering and construction, contour maps are essential for selecting suitable sites and designing infrastructure like roads, dams, tunnels, and buildings safely and efficiently. Hydrologists use them to study drainage systems and manage water flow, while environmental scientists rely on them for ecosystem analysis and conservation planning. Surveyors depend on contour mapping for accurate land measurement and boundary identification. They are also valuable in disaster management for flood risk assessment and landslide prediction. Overall, contour maps provide a clear and reliable representation of terrain, supporting informed decision-making in planning, development, and natural resource management.
For more information or any questions regarding our services, please don't hesitate to contact us at
Email: info@geowgs84.com
USA (HQ): (720) 702–4849
India: 9009471866 - Jay Sharma
Canada: (519) 590 9999
Mexico: 55 5941 3755
UK & Spain: +44 12358 56710