Contour Mapping 101: Everything you need to know.
- Howard Krinitzsky

- Aug 28, 2023
- 4 min read
Updated: Apr 30
Contour mapping is a technique used in cartography and geography to represent the three-dimensional shape and elevation of the Earth's surface on a two-dimensional map. Contour maps display lines called "contour lines" that connect points of equal elevation above a reference datum, typically mean sea level. These lines help visualize the topography and relief of a region, making it easier to understand the landforms and changes in elevation.

Important aspects to know about contour mapping:
Contour Lines: Contour lines are continuous lines on a map that connect points at the same elevation. Each line represents a specific elevation, called the contour interval. The distance between contour lines indicates terrain steepness—closely spaced lines show steep slopes, while wider spacing represents gentle slopes.
Contour Interval: The contour interval is the difference in elevation between two adjacent contour lines. A smaller contour interval provides more detailed information about elevation changes, but results in more contour lines on the map.
Topography Representation: Contour maps visually represent the shape and elevation of the land, highlighting features such as hills, valleys, ridges, and depressions. Closely spaced contour lines indicate steep slopes, while widely spaced lines represent gentle or flat terrain.
Index Contours: Thicker or labeled contour lines are known as "index contours." They typically carry elevation labels and help users quickly identify the elevation of the land at specific points on the map.
Depressions and Hills: Contour lines form closed loops around depressions (like valleys) and hills. Inside a closed loop, the elevation is lower than the contour line values. For hills, the highest point is found at the center of concentric contour lines.
Spot Elevations: Spot elevations go on the tops and saddles of the elevation terrain. They are used to show the top of a hill that is above the contour line, but not high enough to make drawing a contour line at the next interval. Spot elevations are used in larger open areas, showing elevations so the viewer knows that a contour line was not missed in large flat areas.
Contour Interval Selection: The choice of contour interval depends on the scale of the map and the terrain's complexity. Steeper terrain might require a smaller interval to accurately depict elevation changes.
Use cases of Contour Mapping
Contour mapping serves a variety of practical and scientific purposes due to its ability to visually represent the elevation and topography of an area. Here are some of the key uses of contour mapping:
GIS: Contour maps are a core element of GIS, widely used for spatial analysis, urban planning, and natural resource management. Within GIS platforms, contour data supports slope analysis, drainage modeling, terrain evaluation, and land suitability assessments for diverse applications.
Engineering and Construction: Engineers and architects use contour maps to plan infrastructure projects such as roads, bridges, and buildings. Contour information helps identify suitable locations, assess potential drainage issues, and design structures that account for elevation changes.
Environmental Management: Contour maps assist in studying watersheds, erosion patterns, and flood risks. They provide insights into how water flows through a landscape and help plan strategies to mitigate environmental risks.
Agriculture: Farmers use contour maps to design terraces, irrigation systems, and drainage systems that work effectively with the natural slope of the land. This reduces soil erosion, water wastage, and crop damage.
Geology and Earth Sciences: Contour maps are crucial for geologists to understand geological formations, faults, and landforms. They aid in locating mineral resources, understanding rock layers, and assessing the geologic history of an area.
Outdoor Recreation: Contour maps are commonly used by hikers, backpackers, and outdoor enthusiasts to plan routes, estimate trail difficulties, and navigate safely through challenging terrains.
Cartography: Creating accurate topographic maps requires contour data. These maps are used for navigation, exploration, and spatial analysis in various fields.
Land Surveying: Surveyors use contour maps as a basis for property boundaries, land division, and land development projects. They help identify potential challenges related to land grading and building placement.
Natural Resource Management: Foresters and conservationists use contour maps to plan sustainable logging, reforestation, and habitat restoration projects that take the existing terrain into account.
Urban Planning: Urban planners use contour maps to make informed decisions about zoning, building heights, and infrastructure placement in a way that respects the natural topography of an area.
Disaster Preparedness: Contour maps help emergency responders understand the terrain of areas affected by natural disasters, enabling better planning for rescue and relief operations.
Education and Research: Contour maps are useful educational tools that help students and researchers understand topography, elevation changes, and spatial relationships.
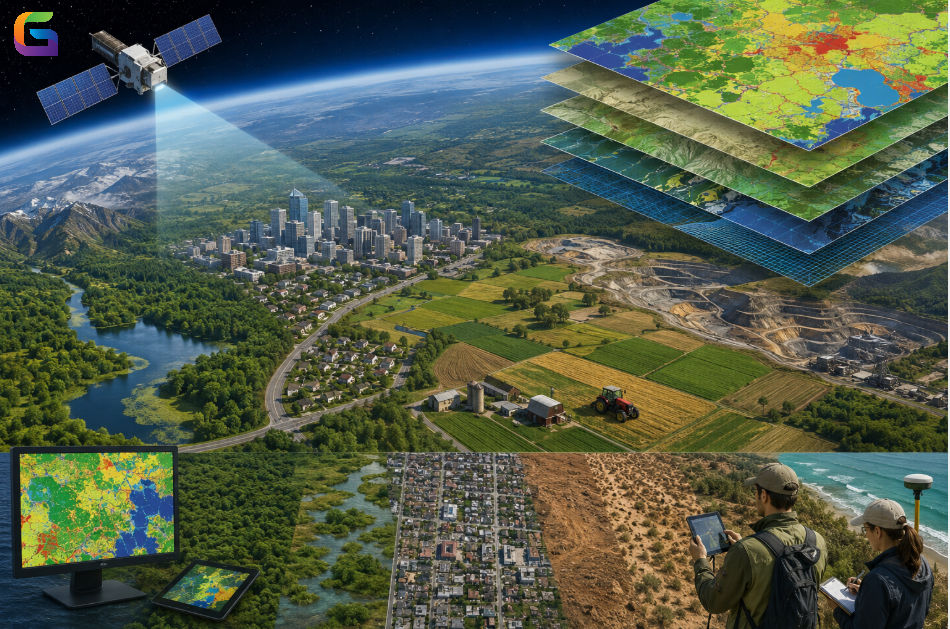
Remote Sensing and Satellite Imagery: Combining contour data with satellite imagery helps in a more accurate analysis of terrain features and changes over time, especially in remote or inaccessible areas.
For more information about our contour mapping services, please feel free to reach out to us at:
Email: info@geowgs84.com
USA (HQ): (720) 702–4849
India: 98260-76466 - Pradeep Shrivastava
Canada: (519) 590 9999
Mexico: 55 5941 3755
UK & Spain: +44 12358 56710


Comments