Air Pollution Tracking Across Borders Using Satellite Data and Geospatial Intelligence
- Anvita Shrivastava
- 1 minute ago
- 4 min read
Air pollution does not obey political boundaries. Emissions from any country may cross into another country from very long distances and negatively affect their air quality, ecosystem, and the health of people who live close to the source of the emissions. Due to technological advancements in satellite remote sensing and geospatial intelligence, we can now monitor and analyze when and where air pollution crosses international borders very precisely.
Why Cross-Border Air Pollution is an Important Issue
Transboundary air pollution is a global issue. Gases, such as NO2, SO2, CO, and PM2.5, have the potential to travel great distances from their source through the movement of the atmosphere.
Air pollution can severely impact public health, agriculture, and political relationships between bordering countries:
In e.g., downwind regions, degraded air quality.
Increased risk to human health (respiratory and cardiovascular diseases)
Agricultural loss through yield reductions or damaged crops
Political tensions due to an inter-country problem where one country is being negatively affected by another.
Knowledge of where pollution originates and how it migrates from point A to B is critical for developing international policy, reaching climate agreements, and holding each other accountable for environmental impacts.
Role of Satellite Data in Air Pollution Monitoring
Satellite data provide a consistent view of the atmosphere, which allows for large-scale coverage of air pollution. Unlike ground stations, satellites provide
All parts of the globe can be monitored, including remote and highly indexed areas.
Multiple times each day can be monitored.
Multiple wavelengths can be monitored to detect various types of air pollution.
Types of Satellite-based Missions for Monitoring Air Pollution:
The Sentinel-5P satellite is providing high-resolution data on NO2, SO2, CO2, and ozone.
The MODIS satellite will be utilized to retrieve aerosol optical depth for monitoring particulate matter.
The VIIRS satellite is being utilized for monitoring nighttime lights, as well as the detection of aerosols.
The Ozone Monitoring Instrument (OMI) will be used to track long-term trends in the composition of the atmosphere.
Each of these datasets is freely available and can provide the backbone of a pollution intelligence system.
Geospatial Intelligence: Turning Data into Insights
Just having a satellite image by itself does not provide enough information. Geospatial intelligence integrates remote-sensed data with spatial analytics, modeling, and visualization to create actionable knowledge.
Core functions within GEOINT will include:
Data ingestion and processing,
• Atmospheric correction,
• Cloud masking,
• Temporal aggregation of data,
Spatial analytics,
• Hotspot detection,
• Trend analysis,
• Source attribution,
Atmospheric modeling,
• Wind vector analysis,
• Dispersion modeling,
• Backward trajectory modeling (e.g., HYSPLIT),
Visualization/mapping,
• Interactive dashboards,
• Time series animations, and
• Map of cross-border pollution pathways.
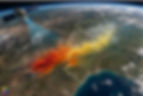
Visualizing Pollution Crossing Borders
GEOINT can visualize where pollutants travel across national borders. There are five procedures used for that purpose. They include:
Time-series mapping (spatially represents contaminant concentrations over time),
Wind overlays (superimposing satellite pollutions onto wind data to calculate direction),
Trajectory modeling (using models such as HYSPLIT to visually trace the path of contaminants backward and forward in time),
Heatmap/contour mapping (providing visual indications of gradient concentrations and areas where contaminants are likely to cross international borders), and
Animated GIS dashboards (allowing visualization of how pollutants change over time – hours/days).
Technologies and Tools
Technologies to track pollution across borders regularly include:
GIS software programs like QGIS and ArcGIS Pro,
Programming tools such as Python (Rasterio, xarray, GeoPandas) and matplotlib,
Cloud services like Google Earth Engine,
Visualization tools including Leaflet, Mapbox, and Kepler.gl,
Data sources from Copernicus Open Access Hub and NASA Earth Data.
Challenges in Tracking Pollution Across Borders
Many challenges still exist around tracking pollution across international boundaries, even though technology has provided many solutions. The following are challenges that must be overcome:
The availability of limited resolution of the data.
The presence of cloud cover can cause an interference effect on measurements.
The challenge is being able to attribute exact sources to pollution.
Political sensitivities and potential restrictions on data sharing.
Uncertainties in atmospheric transport models.
A solution to these problems is the need for improved models, higher-resolution sensors, and greater international cooperation.
Examples of Real-World Applications
Some examples of how cross-border pollution tracking is used include:
Monitoring industrial emissions from facilities located close to national borders.
Tracking the spread of wildfire smoke between countries.
Determining compliance with international environmental agreements.
Supporting policy decisions and diplomacy in relation to environmental issues.
Providing the public with access to environmental data through an open dashboard display.
Future of Geospatial Air Pollution Intelligence
Emerging trends are shaping the future of how pollution is monitored, predicted, and understood, such as:
Using Artificial Intelligence to predict where and when pollution will occur.
Integrating remote sensing data with data from ground-based sensors connected to the Internet of Things.
Developing new missions to gather imagery of Earth at higher resolution from space.
Creating real-time monitoring systems to track air pollution as it travels across borders.
Utilizing digital twins to manage and monitor global systems of water, land, and air.
These trends have a common goal: to improve our ability to detect, predict, and respond to transboundary pollution events.
Measuring and tracking air pollution across national borders no longer exists only in theory; it is now an operational capability supported with satellite imagery and geospatial intelligence. By integrating Earth observation data with advanced analytics, we create dashboards that allow us to visualize where and when pollutants move across international borders; this data enables improved decision-making, accountability, and environmental protection.
For governments and organizations, using these technologies is more than a competitive advantage; it is a fundamental requirement in an age where there is no national boundary to air pollution.
For more information or any questions regarding the geospatial intelligence, please don't hesitate to contact us at
Email: info@geowgs84.com
USA (HQ): (720) 702–4849
India: 98260-76466 - Pradeep Shrivastava
Canada: (519) 590 9999
Mexico: 55 5941 3755
UK & Spain: +44 12358 56710