
Time Series Analysis for Monitoring Land Surface Changes

Updated: Oct 8
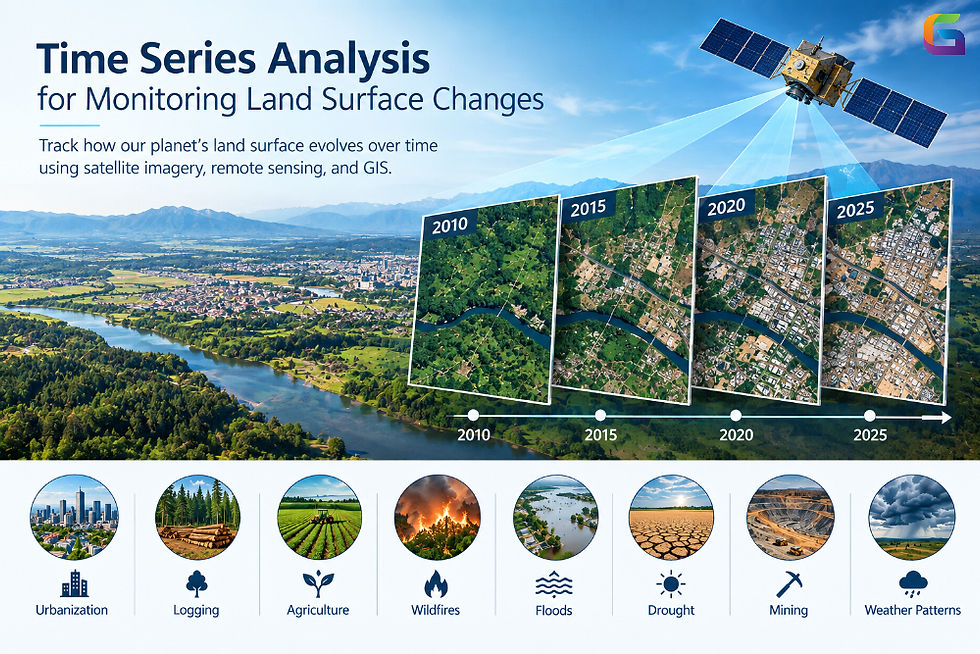
The Earth's land surface is always in flux because of both natural processes and human activities. Urbanization, logging, agriculture, wildfires, floods, drought, mining, and weather patterns can significantly change the landscape over time. Tracking such changes involves more than analyzing just one snapshot. A time series approach provides a systematic means of monitoring the evolution of land surface in time.
Using a combination of satellite imagery, remote sensing, geographic information systems (GIS), and time series methods, geospatial experts can spot trends, detect abnormalities, research changes in land use, and assist in environmental programs and decision-making in land management.
What Is Time Series Analysis in Remote Sensing?
The term time series analysis describes a method of investigating the occurrence of data acquired at different times for the purpose of determining any changes in the observed phenomenon over time.
In remote sensing, a time series may be formed by processing satellite images harvested over the course of weeks, months, or years. Each satellite image depicts the condition of the Earth at a particular moment.
For example, a vegetation monitoring process may utilize the satellite images obtained at intervals of 10-16 days. This way, the vegetation indices for each image need to be calculated to know if the vegetation is increasing, decreasing, or staying at the same level.
An ordinary time series (geospatial) may be expressed with the following equation:
Observation = f(location, time, spectral/environmental variable)
The variable being applied in the analysis may consist of:
Surface reflectance
Land surface temperature
Normalized Burn Ratio (NBR)
Soil moisture
Snow cover
Surface water area
Urban area
Altitude or deformation measurements
Why Monitor Land Surface Changes Over Time?
While a satellite image gives you a single view, a time series describes the evolution of various observations.
Temporal analysis allows you to distinguish ephemeral changes from persistent ones, as certain observations may indicate deterioration of vegetation when they are instead due to seasonal factors.
When analyzing time series, you can answer questions such as:
What changes have taken place in the status of vegetation in a decade?
Where did the urban expansion happen?
Where did the area get flooded repeatedly?
How fast did vegetation recover after a fire?
Where are forests shrinking?
How have the water bodies changed in size?
Which areas of agriculture showed the wrong seasonal dynamics?
Where is the land surface changing over a long period of time unnecessarily?
This information is useful for environmental monitoring, agriculture, forestry, urban development, disaster management, and other climate sciences.
Satellite Imaging for Time Series of Land Surface
Satellite images are a key data source in land surface time series studies since satellites can monitor different geographical areas over time.
Sources of satellite data:
Landsat – preferable for land surface monitoring and historical analysis.
Sentinel-2 – offers multispectral images suitable for vegetation, agricultural, water, and land cover analyses.
Sentinel-1 – offers Synthetic Aperture Radar (SAR) data, helping monitor the land even when it is cloudy.
MODIS – effective for monitoring the environment at a global level on a regular basis.
Private satellite images – help obtain high-resolution data that allows accurate monitoring.
Imagery choice is based on the needed spatial resolution, temporal resolution, spectral properties, and research aim.
Building a Land Surface Time Series
In building an effective land surface time series from satellite images, it is important to remember that the mere stacking of images is not enough. The datasets need to be prepared properly so that any differences in observations reflect changes on the surface rather than the artifacts of image processing.
Typically, the following steps are included in the workflow.
Identify the Area of Interest
The area that is going to be monitored first needs to be defined. The area may be a city, agricultural fields, watershed, forest, mining area, coastline, or any other region.
The constant Area of Interest facilitates comparing data at various time points.
Gather Images of Various Dates
Next, images are gathered at different time points. Depending on the purpose of the monitoring, different acquisition frequencies should be applied; a long-term land cover analysis could involve gathering images once a month or year, while crop monitoring or flood detection might require monitoring every few days.
Carry out Preprocessing
Preprocessing of satellite data is generally required before temporal analysis.
The most common preprocessing operations are:
Atmospheric correction
Radiometric calibration
Geometric correction
Cloud and shadow masking
Resampling
Mosaicking
Reprojecting
NoData handling
Spatial alignment
It is important to conduct consistent preprocessing since any variations in image quality or processing may lead to false results.
Calculate Spectral Indices
Spectral indices can convert multispectral satellite imagery into specific measurements concerning land surface characteristics.
For example, NDVI is often used for vegetation monitoring.
NDVI = (NIR – Red) / (NIR + Red)
where NIR is near-infrared reflectance, and Red is red band reflectance.
Other useful indices include:
Then, the index values can be assessed over time.
Time Series Analysis with GIS and Python
The workflow of modern geospatial tasks involves the integration of GIS technology with programming languages for the execution of time series analysis.
Python has many libraries that can process satellite and geospatial time series:
Xarray, which handles multidimensional labeled arrays.
rioxarray for raster data associated with geospatial metadata.
Rasterio for raster processing.
GeoPandas for vector geospatial data.
NumPy for numerical computation.
Pandas for tabular time series data.
Matplotlib for visualization.
scikit-learn for machine learning.
Dask for parallel and big data processing.
For example, two-dimensional satellite datasets can be organized according to the following multidimensional structure:
time x latitude x longitude x band.
In this case, time series analysis can be performed over millions of pixels.
Land Surface Monitoring in the Future
The land surface monitoring system will hinge upon cloud computing in geography, AI, and large satellite data storage.
Using artificial intelligence models, the different types of images gathered at different times can be interpreted to see intricate patterns that wouldn’t otherwise be viewed with ordinary threshold techniques.
The systems created especially for the visualization and processing of data in the cloud allow further simplifying the process of working with raster, vector, DEM, LiDAR, and SAR data.
Time series analysis offers an effective framework for monitoring changes in land surface by using repeated geospatial observations. By combining satellite images, geomatics, GIS, spectral indices, data analysis, and machine learning technology, one can identify patterns, seasonal changes, anomalies, and long-term shifts in large areas.
The possibilities of temporal satellite data are unlimited. They include, but are not limited to, vegetation monitoring, agricultural analysis, urban development, wildfire evaluation, flooding, and environmental monitoring.
Today and in the future, satellite databases will keep increasing, as will the capabilities of cloud spatial technology, thus making time series analysis crucial for current systems of GIS and Earth observation.
For more information or any questions regarding Time Series Analysis, please don't hesitate to contact us at
Email: info@geowgs84.com
USA (HQ): (720) 702–4849
India: 98260-76466 - Pradeep Shrivastava
Canada: (519) 590 9999
Mexico: 55 5941 3755
UK & Spain: +44 12358 56710


Comments