Digital Surface Models: Benefits, Challenges, and Best Practices
- utkalsharma
- Dec 4, 2024
- 9 min read
Updated: Dec 13, 2024
Are you looking to take your data visualization to the next level? Then it's time to explore the power and potential of Digital Surface Models (DSMs). By incorporating this cutting-edge technology into your data visualization strategy, you can unlock new insights and transform complex data into interactive and compelling visuals.
DSMs offer a high-resolution representation of the Earth's surface, allowing you to model terrain, buildings, and other geographical features with remarkable accuracy. This level of detail enables you to analyze and present data in a way that traditional visualization methods simply can't match. Whether you're working in urban planning, environmental analysis, or any field where spatial data is crucial, DSMs can provide a valuable tool to enhance your projects.
In this article, we will delve into the world of DSMs and explore their benefits, applications, and potential for data visualization. We will also discuss how to integrate DSMs into your workflow and highlight some real-world examples of their effective usage. So, get ready to unlock the power of DSMs and elevate your data visualization game to new heights.
Understanding the importance of data visualization
Data visualization is a powerful tool that transforms complex data sets into understandable and actionable insights. In an age where information overload is prevalent, the ability to visually represent data allows individuals and organizations to discern patterns, trends, and outliers quickly. Visualizations can simplify the interpretation of large datasets, making them more accessible to a broader audience, including stakeholders who may not have a technical background. By utilizing charts, graphs, and maps, data visualization helps convey intricate stories within the data, facilitating informed decision-making processes.
Moreover, effective data visualization can enhance communication and collaboration among teams. When data is presented visually, it fosters discussions that lead to a deeper understanding of the subject matter. Teams can identify correlations and discrepancies within the data, leading to more strategic planning and innovative solutions. This is especially critical in fields like healthcare, urban planning, and environmental science, where data-driven decisions can significantly impact outcomes. Ultimately, the importance of data visualization lies in its ability to bridge the gap between data complexity and user comprehension, making it an indispensable tool in today’s data-driven world.
Furthermore, the rise of digital technology has significantly advanced the methods available for data visualization. With sophisticated tools and software, users can create dynamic, interactive visualizations that engage viewers and allow for real-time data manipulation. This level of interactivity not only makes data exploration more intuitive but also encourages users to delve deeper into the data. As organizations increasingly rely on data to drive their strategies, the demand for high-quality visualization techniques continues to grow, underscoring the critical role that data visualization plays in extracting value from information.
What are Digital Surface Models (DSMs)?
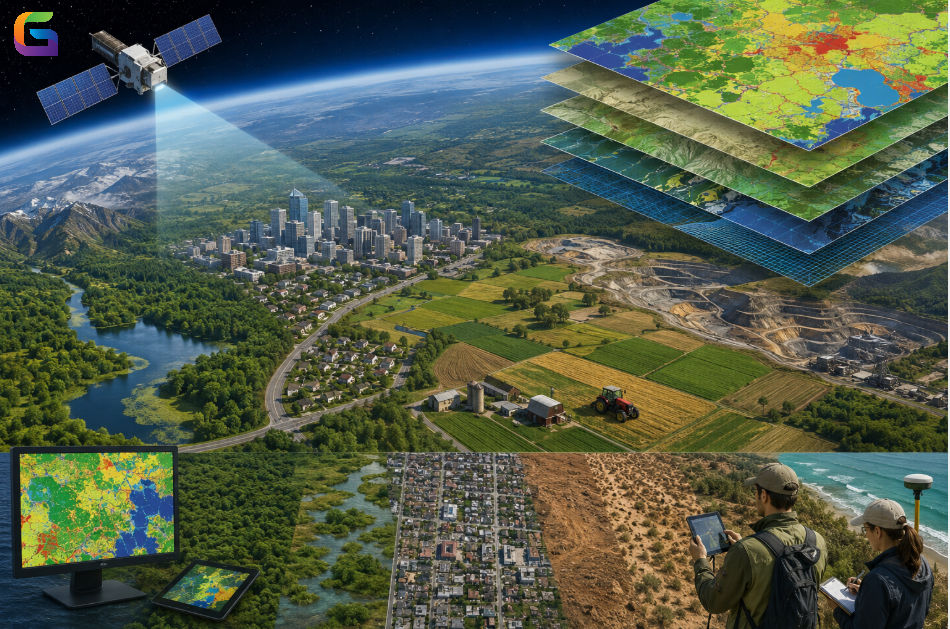
Digital Surface Models (DSMs) represent the Earth's surface, capturing the heights of natural and artificial features. Unlike Digital Elevation Models (DEMs), which depict bare earth without vegetation or structures, DSMs include all elements of the landscape, such as trees, buildings, and other man-made structures. This comprehensive representation is achieved through various data collection methods, including aerial photography, LiDAR (Light Detection and Ranging), and satellite imagery. The resulting models provide a high-resolution three-dimensional view of the terrain, enabling detailed analysis and visualization of surface features.
DSMs are crucial for numerous applications in geography, urban planning, and environmental monitoring. They facilitate a better understanding of topography and land use while also aiding in the assessment of environmental impacts. By incorporating DSMs into various workflows, professionals can generate more accurate simulations of how changes in the landscape affect water flow, vegetation growth, and urban development. This multidimensional perspective allows for more informed decision-making and strategic planning in various fields.
Moreover, the advancement of technology has significantly enhanced the accessibility and usability of DSMs. As software tools evolve, the integration of DSMs into GIS (Geographic Information Systems) platforms has become more seamless, allowing users to manipulate and analyze these models with relative ease. As a result, DSMs are becoming a standard component in data visualization strategies, providing rich, engaging visuals that capture the complexities of the environment in a way that traditional methods cannot.

Applications of Digital Surface Models in various industries
Digital Surface Models have a wide range of applications across multiple industries, showcasing their versatility and effectiveness in spatial analysis. In urban planning, DSMs are invaluable for assessing land use, infrastructure development, and environmental impacts. Planners can simulate various scenarios, such as the addition of new buildings or parks, to visualize how these changes will affect the existing landscape. This capability enhances the planning process, ensuring that developments are sustainable and aligned with community needs.
In the field of environmental science, DSMs play a critical role in monitoring and managing natural resources. They are used to model watershed dynamics, analyze vegetation cover, and assess the impacts of climate change on ecosystems. By visualizing terrain and surface features, researchers can identify areas prone to flooding, erosion, or habitat loss, enabling proactive measures to protect vulnerable environments. DSMs also facilitate the study of wildlife habitats, providing insights into how landscape changes affect biodiversity.
Additionally, DSMs are increasingly utilized in the telecommunications industry for optimizing network coverage and performance. By analyzing the height and distribution of buildings and other structures, companies can plan the placement of cell towers and antennas more effectively. This ensures that network connectivity is reliable, particularly in urban areas where obstacles can impede signal strength. The ability to visualize and analyze these factors using DSMs leads to improved service delivery and customer satisfaction.
Benefits of using Digital Surface Models for data visualization
The integration of Digital Surface Models into data visualization offers numerous benefits that enhance the quality and effectiveness of visual representations. One of the primary advantages is the high level of detail and accuracy that DSMs provide. This precision allows users to create realistic visualizations that reflect the complexities of the real world, making it easier for audiences to grasp the nuances of the data. Whether in presentations or reports, the clarity that DSMs bring can significantly impact how information is perceived and understood.
Another benefit of using DSMs is their ability to facilitate advanced spatial analyses. With their comprehensive representation of the Earth's surface, users can explore relationships between different features and layers of data. This capability enables in-depth analyses, such as identifying areas of potential risk or opportunities for development. The insights gained from these analyses can inform decision-making processes across various fields, from urban planning to environmental management, leading to more effective outcomes.
Furthermore, DSMs enhance the interactivity and engagement of data visualizations. By incorporating three-dimensional models, users can create immersive experiences that allow viewers to explore data from multiple angles. Such interactivity encourages deeper engagement with the content, fostering a sense of discovery and curiosity. As audiences become more involved in the data exploration process, they are likely to retain information better and draw more informed conclusions, ultimately leading to a higher impact of the visualizations.

How to Create Digital Surface Models
Creating Digital Surface Models involves several steps, beginning with data collection. The two most common methods for obtaining the necessary data are aerial surveying and satellite imaging. Aerial surveys, often conducted using drones or aircraft equipped with LiDAR, provide high-resolution data that captures the height of features above the ground. Alternatively, satellite imagery can offer a broader view, though it may be less detailed. The choice of data collection method depends on the project's specific requirements, including the desired resolution and the geographic area of interest.
Once the data is collected, the next step is data processing. This involves filtering and correcting the raw data to remove noise and inaccuracies. For LiDAR data, this process may include classifying points to distinguish between ground and non-ground features. Geographic Information System (GIS) software is commonly used in this stage, allowing users to manipulate and analyze the data effectively. After processing, the data can be transformed into a raster format, creating the foundation for the DSM.
Finally, visualization and analysis can be performed using specialized software tools. These tools enable users to create detailed 3D models and visualizations that represent the surface features accurately. Users can overlay additional data layers, such as vegetation indices or urban development plans, to enhance the model's utility. By integrating various data sources, the final product becomes a powerful visualization tool that can be used for presentations, reports, or strategic planning, showcasing the full potential of Digital Surface Models.
Tools and software for working with Digital Surface Models
A variety of tools and software are available for working with Digital Surface Models, catering to different needs and expertise levels. Geographic Information System (GIS) platforms such as ArcGIS and QGIS are among the most widely used. These programs offer robust capabilities for processing, analyzing, and visualizing spatial data. Users can manipulate DSMs within these environments, overlaying additional data layers and performing spatial analyses to derive meaningful insights.
In addition to GIS software, specialized tools for LiDAR data processing, such as LAStools and GeoSLAM, are essential for creating accurate DSMs. These programs allow users to filter and classify LiDAR data, ensuring that the resulting models are precise and useful for analysis. Depending on the project requirements, users may choose tools that best fit their workflow, whether for large-scale projects requiring extensive processing or smaller projects where speed is a priority.
For visualization, software like Blender and SketchUp can be utilized to create stunning 3D representations of DSMs. These applications offer advanced modeling and rendering capabilities, allowing users to present their data in visually appealing formats. Additionally, web-based platforms such as Cesium and Mapbox provide interactive mapping solutions that enable users to share their models online, fostering collaboration and communication among stakeholders. By leveraging these tools, professionals can maximize the potential of Digital Surface Models in their data visualization efforts.
Best practices for effective data visualization using Digital Surface Models
To maximize the effectiveness of data visualization using Digital Surface Models, several best practices should be followed. First and foremost, clarity is key. Visualizations should be designed with the audience in mind, ensuring that complex data is presented in an easily digestible format. This might involve simplifying visuals, using clear labels, and avoiding clutter that can distract from the main message. A well-organized layout enhances comprehension and allows viewers to focus on the essential elements of the visualization.
Additionally, leveraging color effectively can enhance the interpretability of DSMs. Color gradients can be used to represent elevation changes or different surface features, making it easier for viewers to identify patterns and anomalies. However, it is crucial to choose a color palette that is accessible to all viewers, including those with color vision deficiencies. Using contrasting colors and clear legends can help convey information more effectively while ensuring inclusivity.
Another best practice involves incorporating interactivity into visualizations. By allowing users to explore the DSM from different perspectives or to manipulate data layers, engagement increases, and the likelihood of drawing meaningful insights rises. Interactive features such as zooming, panning, and filtering empower users to tailor their experience to their specific interests. This dynamic approach not only makes the visualization more engaging but also encourages deeper exploration of the data.
Case studies showcasing the power and potential of Digital Surface Models
Several case studies illustrate the transformative impact of Digital Surface Models across various sectors. One notable example is the use of DSMs in flood risk assessment. In regions prone to flooding, researchers utilized DSMs to model water flow and identify flood-prone areas. By analyzing the terrain and surface features, they developed predictive models that enabled local governments to implement effective flood management strategies. This proactive approach not only safeguarded communities but also optimized resource allocation for emergency services.
In urban planning, a city utilized DSMs to visualize the potential impacts of new infrastructure projects on existing neighborhoods. By incorporating DSMs into their planning processes, city officials could simulate the visual aesthetics and environmental effects of proposed developments. This transparency fostered community engagement, as residents could better understand potential changes to their surroundings. The collaborative approach not only benefited the planning process but also built trust between city officials and community members.
Another compelling case is the application of DSMs in forestry management. In a region facing deforestation challenges, researchers employed DSMs to monitor changes in forest cover over time. By comparing historical and current models, they identified areas of significant change, facilitating targeted conservation efforts. This data-driven approach enabled stakeholders to make informed decisions regarding sustainable forestry practices, ultimately contributing to environmental preservation and biodiversity protection.
Digital Surface Models represent a powerful tool that can significantly enhance data visualization efforts across various fields. Their ability to provide high-resolution, three-dimensional representations of the Earth's surface allows for detailed analysis and insightful interpretations of complex datasets. As we have explored, the applications of DSMs are vast and varied, ranging from urban planning and environmental monitoring to telecommunications and forestry management.
By integrating DSMs into data visualization strategies, professionals can unlock new insights and foster better decision-making processes. The benefits of using DSMs—such as improved clarity, enhanced interactivity, and the capability for advanced analysis—underscore their importance in today’s data-rich environment. Moreover, the advancements in software and tools make it easier than ever to create, manipulate, and visualize these models, empowering users to effectively communicate their findings.
As we move forward in an increasingly data-driven world, harnessing the power of Digital Surface Models will be essential for impactful data visualization. By adhering to best practices and learning from successful case studies, individuals and organizations can leverage DSMs to transform their data into compelling visuals that drive understanding and inspire action. Embracing this technology will undoubtedly lead to more informed decisions, innovative solutions, and ultimately, a deeper appreciation of the complexities of our environment.
Email: info@geowgs84.com
USA (HQ): (720) 702–4849
India: 98260-76466 - Pradeep Shrivastava
Canada: (519) 590 9999
Mexico: 55 5941 3755
UK & Spain: +44 12358 56710


Comments